
A cornerstone map of Danish St. Croix and its plantation sugar economy
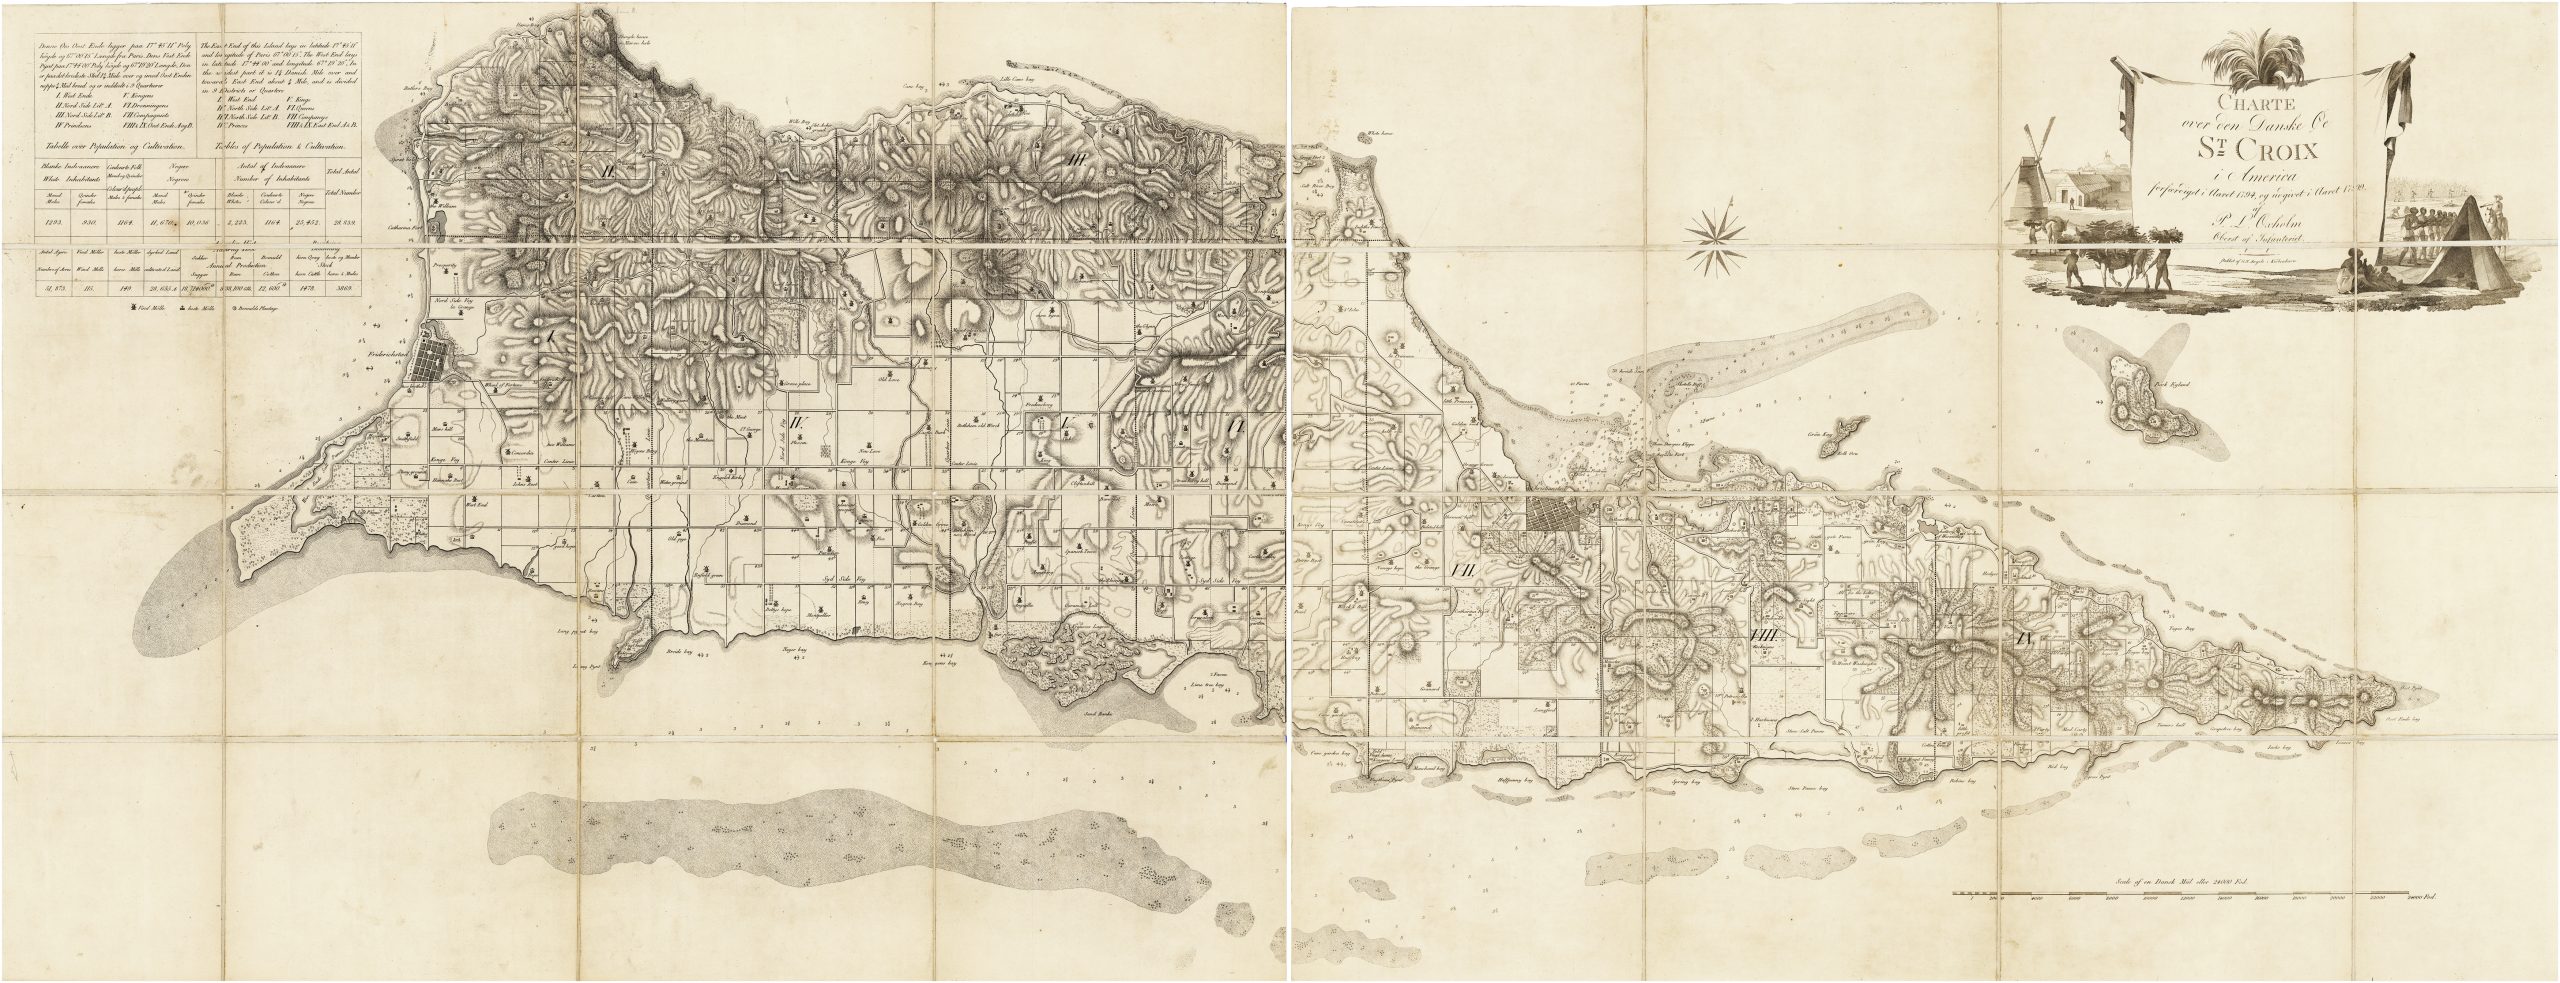
Peter Lotharius Oxholm / G[ottfried] N. Angelo (engraver), Charte over den Danske Øe St Croix i America forfærdiget i Aaret 1794, og udgivet i Aaret 1799. af P. L. Oxholm Oberst af Infanteriet. Copenhagen: Peter Lotharius Oxholm, 1799.
Engraving on late 18th-century laid paper, uncolored. Dissected into sections and mounted on linen, the sections 26”h x 34 ¼”w and 26”h x 33 7/8”w respectively, if joined 26”h x 68 1/8”w. Folding into a contemporary marbled paper slipcase. Minor soiling and occasional very faint offsetting, but excellent overall.
$17,500.00
In stock
First edition of the definitive early mapping of St. Croix, mapping the island’s geography, infrastructure, and plantation economy at its late 18th-century zenith. Exceptionally rare on the market.
Peter Lotharius Oxholm and the survey of St. Croix
Oxholm (1753–1827), who would later serve as Governor-General of the Danish West Indies, spent years intimately involved with the administration, military defense, and infrastructure development of the islands. Sent to the Danish West Indies in 1777, Oxholm arrived on St. Croix the following year with instructions to survey the islands and assess and improve their defenses. Over the following years, assisted by enslaved workers, Oxholm undertook extensive field surveys while also drawing on the island’s existing cadastral framework and earlier mapping. He also used the opportunity to amass his own substantial plantation holdings.
By the time he completed his map in 1794, the island had approached the peak of its agricultural output and land development. Following the transition from the Danish West India and Guinea Company monopoly to direct Danish Crown rule in 1755, St. Croix had developed a highly lucrative sugar economy driven by a surprisingly cosmopolitan planter class of English, Irish, Dutch, and French settlers.
After completing his map, probably in 1792 or 1793, Oxholm had it engraved in Copenhagen by Gottfried N. Angelo (1767-1816), the engraver to the Videnskabernes Selskab (“Society of Sciences”). However it appears that the Society elected not to offer financial support; indeed one secondary source asserts that “they declined on the grounds that it was too finely detailed, excessively large in scale, and too expensive to engrave.”[1] Oxholm ultimately published the map in 1799 at his own expense, arranging for a print run of 500 copies.[2]
Mapping the plantation landscape
The map divides St. Croix into its nine historical districts or “Quarters” (such as West End, Princes, and Companys), each gridded into meticulously numbered and bounded plantation plots representing the roughly 200 to 250 active estates, with many of the plantations identified by name. Dashed lines at some boundaries indicate parcels joined to form larger plantations. Detailed hachuring defines the island’s mountainous spine, while the coastline is ringed with precise soundings, shoals, anchorages, and navigational hazards.
The two primary towns, Christiansted and Frederiksted, are depicted with their surrounding street grids, anchorages and approaches, and respective fortifications. Throughout the agricultural zones, distinct icons identify the windmills (modeled after Dutch designs) and the animal-driven mills that powered the island’s sugar industry, which required heavy force to crush the sugarcane to extract its juice. A third icon style—a small “+” within a circle—indicates the cotton plantations concentrated at the east end of the island, which was relatively dry and thus better suited to cotton cultivation.
Perhaps the most unusual feature of the map is its integrated statistical data, which lays bare the brutal mechanics and scale of the plantation economy. A dual-language table in Danish and English in the upper left corner provides a stark census for the year 1794: of the island’s 28,839 total inhabitants, only 2,223 were white, with a staggering 25,452 enslaved people forming the essential backbone of the workforce. A third demographic, free people of color, numbered 1,164.
Agricultural output is similarly quantified for the island’s 51,873 total acres, recording 115 windmills, 149 horse-powered mills, over 28,000 actively cultivated acres, and extraordinary annual yields exceeding 18,714,000 pounds of sugar, 838,100 gallons of rum, and 12,600 pounds of cotton.
The cartouche and the “paradox of abolition”
In 1792 the Danish Crown decreed that its transatlantic slave trade would cease in 1803, allowing a ten-year transition before the prohibition took effect. In response to this impending cutoff, Crucian planters aggressively ramped up slave imports to maximize production before the deadline.
Beneath the main title, a highly stylized scene depicts enslaved laborers in various phases of cane planting, harvesting, and transport. Read in the context of the 1792 ordinance and contemporary concern over maintaining the plantation labor force, the woman and children have been interpreted as an image of the biological reproduction of slavery. Helene Engnes Birkeli argues that the cartouche both naturalizes the plantation regime and betrays anxiety about its economic and social instability.
Legacy, rarity, and references
The precision and depth of Oxholm’s work make it an unparalleled primary source for the history of the Caribbean sugar trade and European colonial administration. The intricate layout of estates captured here forms the basis of the landscape still visible on St. Croix today, where the stone ruins of the very windmills Oxholm so carefully plotted continue to dot the island’s topography. The map is at once an extraordinarily detailed record and a product of the colonial plantation system Oxholm administered, defended, and personally profited from.
Oxholm’s map remained for decades the definitive map of St. Croix; indeed, Richard B. Arkway asserted that “it remained so until the United States Coast and Geodetic Survey [map] of 1919-1921.” It was copied for example, albeit at a much smaller scale, by Laurie & Whittle in 1804 and William Faden in 1809. It was re-issued in or around 1820 with a revised title, without the cartouche, significant updates to the harbor and approaches of Christiansted and the waters off the northeast shore, and Bock Island re-engraved.
The 1799 first edition of the map is extremely rare on the antiquarian market: Rare Book Hub records only one other example having appeared for sale, offered in 2004 in Arkway Catalog 58 (#40) for $19,500. The ca 1820 second edition is equally rare, with none recorded by Rare Book Hub, though one was offered in 2026 by an American dealer.
For a thorough discussion of Oxholm, the creation of his map, and its interpretation see Helene Engnes Birkeli, “Cutting the Contact Zone: Race, Temporality and History in Peter Lotharius Oxholm’s Map of St. Croix (1799)”, Object, no. 21, pp. 9-10. The map is discussed and placed in a broader cartographic context at “Historic Maps – Maturing Danish Period – 1778-1779”, at the Windmills of St. Croix website (accessed July 2026). As of July 2026 OCLC #428025882 et al locate examples of the 1799 edition at the Danish National Library (multiple), Bibliotheque national de France, British Library, Dartmouth, National Maritime Museum (UK), Harvard, Staatsbibliothek zu Berlin, University of Leiden, Universite de Montreal, and University of Minnesota.
OCLC records examples of the second, ca 1820 edition of the map at the Bibliotheque national de France, British Library, and the University of Wisconsin, Milwaukee. The Danish National Library also appears to have a copy.
[1] Richard B. Arkway, Catalog 58, #40.
[2] See Birkeli pp. 9-10 for an account of the map’s publication.
Inventory ID:
A cornerstone map of Danish St. Croix and its plantation sugar economy
Peter Lotharius Oxholm / G[ottfried] N. Angelo (engraver), Charte over den Danske Øe St Croix i America forfærdiget i Aaret 1794, og udgivet i Aaret 1799. af P. L. Oxholm Oberst af Infanteriet. Copenhagen: Peter Lotharius Oxholm, 1799.
$17,500.00
In stock
Engraving on late 18th-century laid paper, uncolored. Dissected into sections and mounted on linen, the sections 26”h x 34 ¼”w and 26”h x 33 7/8”w respectively, if joined 26”h x 68 1/8”w. Folding into a contemporary marbled paper slipcase. Minor soiling and occasional very faint offsetting, but excellent overall.
First edition of the definitive early mapping of St. Croix, mapping the island’s geography, infrastructure, and plantation economy at its late 18th-century zenith. Exceptionally rare on the market.
Peter Lotharius Oxholm and the survey of St. Croix
Oxholm (1753–1827), who would later serve as Governor-General of the Danish West Indies, spent years intimately involved with the administration, military defense, and infrastructure development of the islands. Sent to the Danish West Indies in 1777, Oxholm arrived on St. Croix the following year with instructions to survey the islands and assess and improve their defenses. Over the following years, assisted by enslaved workers, Oxholm undertook extensive field surveys while also drawing on the island’s existing cadastral framework and earlier mapping. He also used the opportunity to amass his own substantial plantation holdings.
By the time he completed his map in 1794, the island had approached the peak of its agricultural output and land development. Following the transition from the Danish West India and Guinea Company monopoly to direct Danish Crown rule in 1755, St. Croix had developed a highly lucrative sugar economy driven by a surprisingly cosmopolitan planter class of English, Irish, Dutch, and French settlers.
After completing his map, probably in 1792 or 1793, Oxholm had it engraved in Copenhagen by Gottfried N. Angelo (1767-1816), the engraver to the Videnskabernes Selskab (“Society of Sciences”). However it appears that the Society elected not to offer financial support; indeed one secondary source asserts that “they declined on the grounds that it was too finely detailed, excessively large in scale, and too expensive to engrave.”[1] Oxholm ultimately published the map in 1799 at his own expense, arranging for a print run of 500 copies.[2]
Mapping the plantation landscape
The map divides St. Croix into its nine historical districts or “Quarters” (such as West End, Princes, and Companys), each gridded into meticulously numbered and bounded plantation plots representing the roughly 200 to 250 active estates, with many of the plantations identified by name. Dashed lines at some boundaries indicate parcels joined to form larger plantations. Detailed hachuring defines the island’s mountainous spine, while the coastline is ringed with precise soundings, shoals, anchorages, and navigational hazards.
The two primary towns, Christiansted and Frederiksted, are depicted with their surrounding street grids, anchorages and approaches, and respective fortifications. Throughout the agricultural zones, distinct icons identify the windmills (modeled after Dutch designs) and the animal-driven mills that powered the island’s sugar industry, which required heavy force to crush the sugarcane to extract its juice. A third icon style—a small “+” within a circle—indicates the cotton plantations concentrated at the east end of the island, which was relatively dry and thus better suited to cotton cultivation.
Perhaps the most unusual feature of the map is its integrated statistical data, which lays bare the brutal mechanics and scale of the plantation economy. A dual-language table in Danish and English in the upper left corner provides a stark census for the year 1794: of the island’s 28,839 total inhabitants, only 2,223 were white, with a staggering 25,452 enslaved people forming the essential backbone of the workforce. A third demographic, free people of color, numbered 1,164.
Agricultural output is similarly quantified for the island’s 51,873 total acres, recording 115 windmills, 149 horse-powered mills, over 28,000 actively cultivated acres, and extraordinary annual yields exceeding 18,714,000 pounds of sugar, 838,100 gallons of rum, and 12,600 pounds of cotton.
The cartouche and the “paradox of abolition”
In 1792 the Danish Crown decreed that its transatlantic slave trade would cease in 1803, allowing a ten-year transition before the prohibition took effect. In response to this impending cutoff, Crucian planters aggressively ramped up slave imports to maximize production before the deadline.
Beneath the main title, a highly stylized scene depicts enslaved laborers in various phases of cane planting, harvesting, and transport. Read in the context of the 1792 ordinance and contemporary concern over maintaining the plantation labor force, the woman and children have been interpreted as an image of the biological reproduction of slavery. Helene Engnes Birkeli argues that the cartouche both naturalizes the plantation regime and betrays anxiety about its economic and social instability.
Legacy, rarity, and references
The precision and depth of Oxholm’s work make it an unparalleled primary source for the history of the Caribbean sugar trade and European colonial administration. The intricate layout of estates captured here forms the basis of the landscape still visible on St. Croix today, where the stone ruins of the very windmills Oxholm so carefully plotted continue to dot the island’s topography. The map is at once an extraordinarily detailed record and a product of the colonial plantation system Oxholm administered, defended, and personally profited from.
Oxholm’s map remained for decades the definitive map of St. Croix; indeed, Richard B. Arkway asserted that “it remained so until the United States Coast and Geodetic Survey [map] of 1919-1921.” It was copied for example, albeit at a much smaller scale, by Laurie & Whittle in 1804 and William Faden in 1809. It was re-issued in or around 1820 with a revised title, without the cartouche, significant updates to the harbor and approaches of Christiansted and the waters off the northeast shore, and Bock Island re-engraved.
The 1799 first edition of the map is extremely rare on the antiquarian market: Rare Book Hub records only one other example having appeared for sale, offered in 2004 in Arkway Catalog 58 (#40) for $19,500. The ca 1820 second edition is equally rare, with none recorded by Rare Book Hub, though one was offered in 2026 by an American dealer.
For a thorough discussion of Oxholm, the creation of his map, and its interpretation see Helene Engnes Birkeli, “Cutting the Contact Zone: Race, Temporality and History in Peter Lotharius Oxholm’s Map of St. Croix (1799)”, Object, no. 21, pp. 9-10. The map is discussed and placed in a broader cartographic context at “Historic Maps – Maturing Danish Period – 1778-1779”, at the Windmills of St. Croix website (accessed July 2026). As of July 2026 OCLC #428025882 et al locate examples of the 1799 edition at the Danish National Library (multiple), Bibliotheque national de France, British Library, Dartmouth, National Maritime Museum (UK), Harvard, Staatsbibliothek zu Berlin, University of Leiden, Universite de Montreal, and University of Minnesota.
OCLC records examples of the second, ca 1820 edition of the map at the Bibliotheque national de France, British Library, and the University of Wisconsin, Milwaukee. The Danish National Library also appears to have a copy.
[1] Richard B. Arkway, Catalog 58, #40.
[2] See Birkeli pp. 9-10 for an account of the map’s publication.
Additional information
| year published | 1799 |
|---|---|
| engraver | Angelo, Gofffried N. |
| associations | Angelo, Gofffried N. |


